Market Profile Trading
Market Profile
After spending a lot of time seraching the Holy Graal with
several TA indicators and any sort of funny combination of them, I
realized that it is not there. There is no reason why a price crossing
a MA should continue to rise; it will rise if someone is still buying,
and maybe we can have a clueof this looking at the rising MA.
That's all.
What I like about the Market Profile is that it helps to have a clue of
what is happening, just organizing data and not trying to predict the
future from the past (a bad cognitive bias we have - see Way of the Turtle for a full list). If
there are a lot of people in a square, you can not get the average
height simply looking at them; but if you ask them to arrange
themselves from the smaller to the taller, you can easily know it.
Of course, this is just a technique. Multiple edges are required to trade (unfortunately one of them is being comfortable with random outcomes), but I think this technique gives the edge to find trades with an asymettric risk-rewards distribution, where the probabiliy of profit is greater then the probability of loss.
Action planned
I plan to do only responsive trades; I will choose a position on the
market, long on short based on a daily time frame view and I will trade
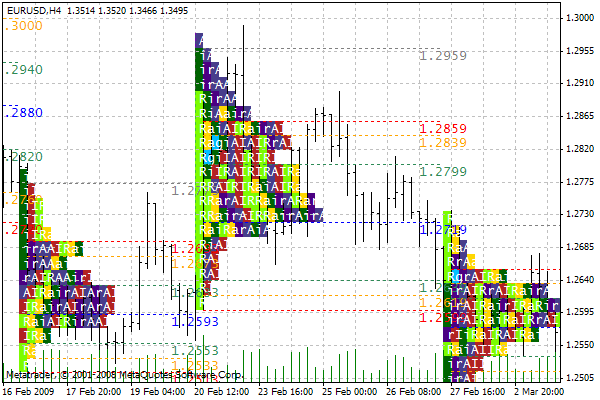
only in that direction. The Market Profile is derived from a H4
timeframe. The start time of the profile is manually selected.
The rules, for a long entry, are:
- the market should reach an oversold level, second standard
deviation, to trigger the order entry (orange line)
- place a stop buy order at the first standard deviation (green line)
- target 1 is the POC level, to cover costs (blue line)
- target 2 is the first standard deviation (green line); if reached,
move the stop to the POC
- sop loss is the unit range (red line)
Anyway discretion is used to set the stop loss, to take profit and to
add new lots.
In this case:
- the order entry is triggered on the 2009.02.25 h 8:00 bar at 1.2893
- the orderis triggered on the 2009.02.25 h 12:00 bar at 1.2799
- the traget 1 is reached on the 2009.02.25 h 16:00 bar at 1.2893
- the traget 2 is reached on the 2009.02.27 h 08:00 bar at 1.2631
A lot of trouble thinking if move the stop loss; I am thinking to move
it if an opposite drection order would be triggered.
